
The capex costs of reaching the Paris goals
We use green bond reporting to compare the environmental impact of a range of green projects. We also apply this information to estimate the capex requirements for reaching net zero.
概要
- Using green bond reporting, we compare the impact of green projects
- Some green projects have a significantly higher abatement efficiency
- We use the data to estimate the capex needed to achieve the Paris goals
Green bonds offer an opportunity to compare the environmental impact of a range of different green projects when using a standardized measure. We use the unit measure tCO2e avoided1 per million euros invested to evaluate the impact of green bond projects across sectors and regions. Our research finds that not all investments in green projects have the same impact: some are more efficient at reducing carbon emissions than others. Using this information, and applying the inverse of our unit measure, we are able to estimate how much capex is needed to achieve the goals of the Paris Agreement.2
Extensive investments are needed to achieve the global ambitions of net zero carbon emissions by 2050. To put the scale of the funding that is needed to transform the world economy into perspective, the International Renewable Energy Agency (IRENA, 2021) estimates that USD 4.4 trillion must be invested annually by 2050 for a 1.5°C climate pathway. This is to finance projects with an abatement value of approximately 1.23 GtCO2e per year,3 including energy transition technologies (renewable energy, end-use electrification, hydrogen innovation) and carbon removal measures. This amount of investment will imply a cost of USD 3,550 per ton of CO2e reduced.
Accounting for the world’s largest asset class, the global fixed income market has a critical role to play in financing the transition to global net zero emissions. The rapidly growing green bond market will play a vital part in this.
Robeco’s fixed income team has been investing in green bonds since 2013 and uses its proprietary five-step green bond screening process to determine whether bonds truly are green. By the end of September 2021, Robeco’s investments in green bonds totaled approximately EUR 3 billion.
Impact reporting of green bonds provides useful information that allows us to assess green projects across sectors and regions from a carbon-abatement-efficiency perspective. We define this comparison as a ‘green impact premium’. This, in turn, enables us to assess the best approach to follow in funding the transition to a green economy.
Deriving a metric to assess green projects
We applied information from more than 440 green bond impact reports from 118 different issuers (from 26 countries and 13 different sectors), and calculated the avoided tons of CO2e emissions per million euros invested for each green bond.
Derived from green bonds, this metric allows investors to compare the climate change mitigation impact of green bonds and simplifies impact reporting for issuers as well as investors. Investors can aggregate the impact metrics of different bonds in their investment portfolios to obtain a portfolio-level impact indicator and, in this way, managers interested in the mitigation potential of their portfolios can use this indicator to select green bonds that are the most efficient from a carbon abatement perspective.
Renewable energy has the highest abatement efficiency
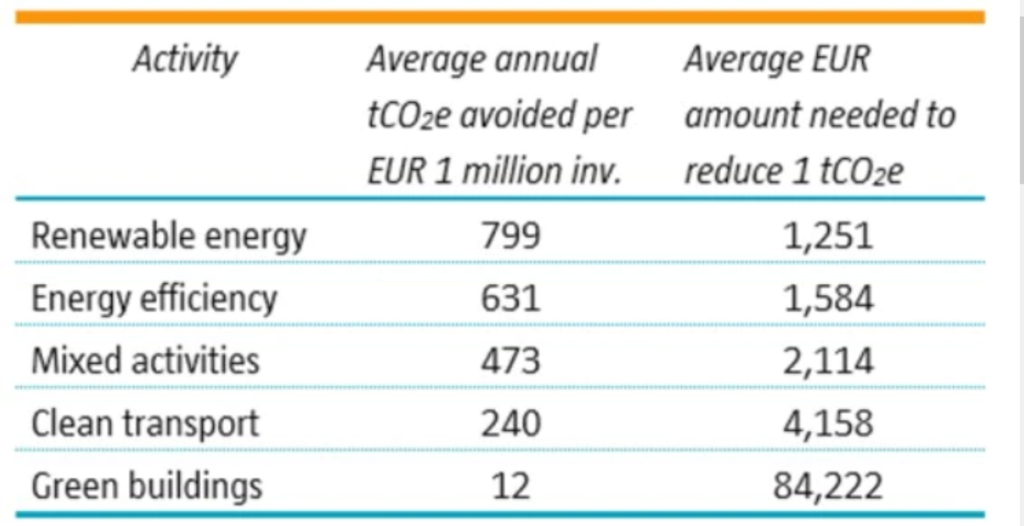
We find that the renewable energy generation sector is the best performer in terms of carbon efficiency. It contributes to avoiding, on average, 799 t CO2e per million euros invested. This result also implies an average cost of EUR 1,251 per ton of CO2e avoided, significantly below the average cost obtained from IRENA after adjusting for foreign exchange effects.
Figure 1 | Global: Average tons of CO₂e emissions avoided per million euros invested and average amounts of euros needed to reduce one ton of CO₂e

Source: Green bond impact reports of multiple issuers. As at October 2021
There were interesting regional differences in these findings. The abatement efficiency of renewable energy projects was higher for projects located in countries with carbon-intensive energy schemes. These projects avoided 78% more CO2e emissions than projects in Europe, implying an average capital cost of EUR 736 per ton of CO2e avoided, significantly below our estimate of the global average for the sector.
On average, projects related to green buildings produced the lowest level of greenhouse gas abatement compared to other types of projects: they facilitated the avoidance of 12 t CO2e per million euros invested. We believe there may be two reasons for this relative underperformance in abatement efficiency. First, the building sector is less expensive to decarbonize and has less abatement potential than other sectors. Secondly, there has been significant progress in improving the energy efficiency of buildings across countries, reducing the current cost differential between green buildings and traditional ones.
Low-carbon transportation projects, which include infrastructure for clean energy vehicles (electric, hydrogen, hybrid), public, rail, and multimodal transportation, are also shown to have high CO22 reduction potential, at 240 t CO2e per million euros invested. Within this category, we found that public transportation projects (passenger rail transport, tram) have higher abatement potential than passenger cars and light commercial vehicles (41 t CO2e per million euros invested).
The activity with the second-largest abatement potential is energy efficiency (smart grids, district heating, energy storage, heat pumps) with 631 t CO2e per million euros invested. It is expected that energy efficiency improvements will contribute 25% of the total mitigation needed to be aligned with a 1.5°C scenario (IRENA, 2021). One clear example is related to heat pumps, which can be powered by renewable electricity and achieve two to five times higher energy efficiency than fossil-fueled boilers.
Assessing the investment opportunity and its scale
Our findings suggest that the existing technology gap between green and traditional alternatives is smaller in the building sector than in the energy sector, which has implications for what investments should be targeted. In particular, sectors in which unabated emissions are higher and technology gaps still exist, such as the energy sector, should receive more abatement investment, to smooth their decarbonization pathway.
Considering the implicit costs of investing in renewable energy and energy-efficiency projects, such as in end-use electrification, power grids, etc., and using the information derived from the green bond impact reports, we can estimate the total value of investment needed to achieve net zero. Our calculations show that the world will need to invest EUR 121.7 trillion in these sectors by 2050. This represents an average annual fund requirement of EUR 4.1 trillion.
To achieve this, the annual capital expenditure in renewable power generation must multiply by 4.5 times, while energy efficiency capex must increase by 2.5 times.
Conclusion
Getting to a net zero outcome by 2050 is an ambitious target. It is also an attractive opportunity for investors: our estimates, based on impact reporting within the green bond market, suggest that EUR 121.7 trillion of capex spending is needed in renewable energy and energy-efficiency projects over the coming three decades.
獲取最新市場觀點
訂閱我們的電子報,時刻把握投資資訊和專家分析。
Footnotes
1 t CO2e avoided: tons of carbon dioxide emissions from fossil fuel or other generation that are avoided due to more efficient energy deployment. The low-carbon investment can either enable emission reductions or provide a low-emission version of a product or service.
2This article is based on the author’s paper “The capex costs of reaching the Paris goals”, November 2021.
3 Gt CO2e: billion tons of carbon dioxide equivalent.
Important information
The contents of this document have not been reviewed by the Securities and Futures Commission ("SFC") in Hong Kong. If you are in any doubt about any of the contents of this document, you should obtain independent professional advice. This document has been distributed by Robeco Hong Kong Limited (‘Robeco’). Robeco is regulated by the SFC in Hong Kong. This document has been prepared on a confidential basis solely for the recipient and is for information purposes only. Any reproduction or distribution of this documentation, in whole or in part, or the disclosure of its contents, without the prior written consent of Robeco, is prohibited. By accepting this documentation, the recipient agrees to the foregoing This document is intended to provide the reader with information on Robeco’s specific capabilities, but does not constitute a recommendation to buy or sell certain securities or investment products. Investment decisions should only be based on the relevant prospectus and on thorough financial, fiscal and legal advice. Please refer to the relevant offering documents for details including the risk factors before making any investment decisions. The contents of this document are based upon sources of information believed to be reliable. This document is not intended for distribution to or use by any person or entity in any jurisdiction or country where such distribution or use would be contrary to local law or regulation. Investment Involves risks. Historical returns are provided for illustrative purposes only and do not necessarily reflect Robeco’s expectations for the future. The value of your investments may fluctuate. Past performance is no indication of current or future performance.


