Subscribe - Indices Insights
Receive an update as soon as a new article is available with insights about sustainability, factors or markets.


This is the first article of a new series, Indices insights, in which we focus on some of the flaws of ESG ratings. Compared to the UN SDGs, the use of ESG ratings has some shortfalls. Indeed, it’s possible for firms that typically appear on asset owners’ exclusion lists to have decent ESG ratings.
Many investors either incorporate sustainability considerations in their portfolios or plan to do so in the future. One of the key motivating factors for this adoption is that it enables investors to align with positive impact, i.e., by allocating capital to companies that are sustainable and which benefit society, while avoiding investments in those that inflict significant harm on it. To achieve this, investors often rely on readily available ESG ratings.
It is, however, important to assess whether these ESG scores appropriately measure societal impact. In our analysis, we scrutinized the ESG ratings of companies that are explicitly earmarked by large institutional asset owners as being bad for society. Surprisingly, we found a weak relationship between the firms that are on exclusion lists and their respective ESG ratings. By contrast, there was a much stronger alignment when we used a measure based on the United Nations Sustainable Development Goals (SDGs).
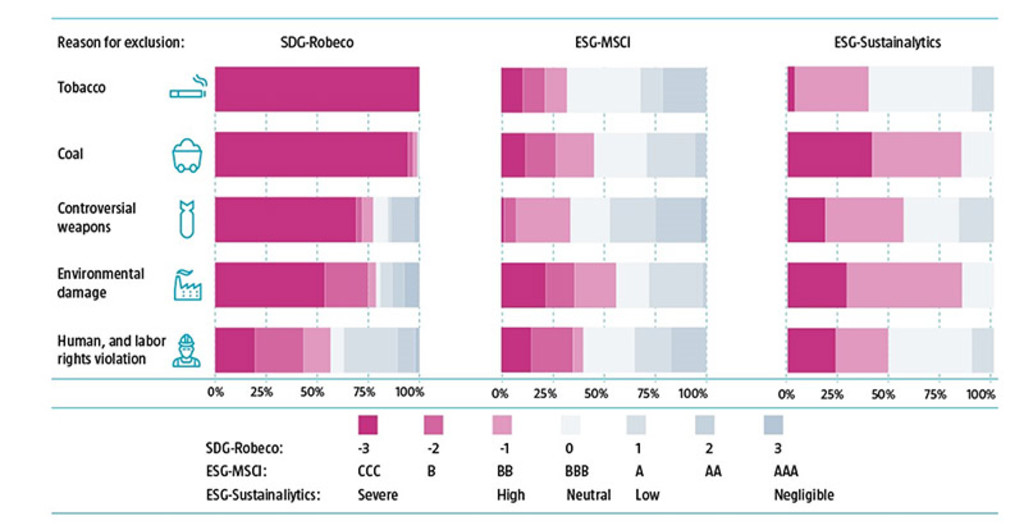
For example, Figure 1 shows that more than half of the tobacco producers that are excluded from the portfolios of large asset owners receive an average ESG rating or are even considered ESG leaders by MSCI. Similarly, more than half of these companies are assessed as having neutral or even low ESG risk according to Sustainalytics. By contrast, all of these firms receive the lowest Robeco SDG score of -3, in line with the harmful products they produce. Similarly, we find that stocks that are avoided for other reasons that are deemed important by large asset owners have SDG scores that are seemingly more aligned with the negative impact they inflict on society.

Source: Robeco, MSCI, Sustainalytics.

Receive an update as soon as a new article is available with insights about sustainability, factors or markets.
For our analysis, we started by collecting exclusion lists. Many institutional investors keep a record of the companies they exclude from their investable universes for regulatory or values-based reasons. Large asset owners often publish ESG policies and sometimes their exclusion lists on their websites. Thus, we were able to download the exclusion lists for some the largest sovereign wealth funds and pension funds globally, as well as their criteria for omitting companies.1
For example, the Norges Bank shares a list of firms that are excluded or under observation for the Government Pension Fund Global. It also provides guidelines which contextualize the reasons why certain businesses are not included in their investable universe, such as precluding investments in companies that produce tobacco-related products given their adverse impact on health.2
We then combined the exclusion lists of the various asset owners and categorized the list of companies according to five commonly used exclusion criteria. Since data coverage is relatively low for micro-cap stocks, we restricted our universe to the constituents of the MSCI ACWI Investable Market Index. In total, we analyzed 293 firms. These were based on the five exclusion criteria: tobacco producers; coal miners and/or coal-based energy producers; controversial weapons manufacturers; companies at fault for significant environmental damage; firms responsible for severe violations of human and/or labor rights.
For each of the stocks that met these exclusion criteria, we analyzed their sustainability scores by referring to three data providers, namely the Robeco SDG scores based on our proprietary SDG framework, MSCI ESG ratings, and Sustainalytics ESG risk ratings. Note that these three data providers use different approaches for their scoring methodologies and that their sustainability scores are not directly comparable.
That said, the sustainability scores clearly differentiate between firms that have a negative, neutral or positive impact on society (Robeco SDG scores); companies that are deemed to be ESG laggards, average in terms of ESG, or ESG leaders (MSCI ESG rating); or businesses that have high, neutral, or low ESG risks (Sustainalytics ESG risk rating).
For instance, the Robeco SDG scores and MSCI ESG ratings apply a categorical scale, ranging from -3 to +3, and from CCC to AAA respectively. The Sustainalytics ESG risk ratings assign a quantitative risk score that is used to place a company in one of five risk categories, ranging from severe to negligible. This is summarized in Table 1.

Source: Robeco, MSCI, Sustainalytics.
Based on our analysis, we conclude that ESG ratings may not effectively capture the impact companies have on society, which is a key consideration for large institutional asset owners. An SDG-based approach takes into account how companies impact the SDGs. In our view, such an approach can enable investors to align their portfolios with positive impact, by avoiding investing in firms that contribute negatively to the SDGs.
In defining sustainability, investors have a multitude of dimensions and metrics they could consider. For example:
Values-based exclusions
ESG integration
Impact investing
ESG scores typically put more focus on the operations of a business, whereas SDG scores also incorporate the impact that the business’ products and/or services have on society.
We see client sustainability objectives increasingly moving towards avoiding controversial businesses (values-based exclusions) and including those that provide sustainable solutions (impact investing). In the first few articles of our Indices Insights series, we will empirically show how the different sustainability metrics (negative screening/exclusions, ESG, SDG) relate to these increasingly impact-oriented client sustainability objectives.
1 We observe that large asset owners in Northern Europe and the Pacific region, in particular, are more likely to disclose their exclusion lists compared to other regions.
2 See: https://www.nbim.no/en/the-fund/responsible-investment/exclusion-of-companies/